Data Visualization in Power BI: Create Your First Dashboard
About this Course
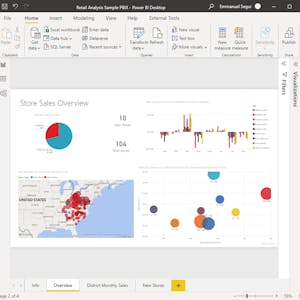
Connect Power BI to different sources to create interactive dashboards in Power BI. For example, a data analyst can build a dashboard that is interactive and can track key business metrics to help business stakeholders make actionable business decisions.Created by: Coursera Project Network

Related Online Courses
AWS: Network Security, Compliance and Governance is the third course of Exam Prep ANS-C01: AWS Certified Advanced Networking Specialty specialization. This course will help learners designing and... more
This course is best suited for individuals currently in the healthcare sector, as a provider, payer, or administrator. Individuals pursuing a career change to the healthcare sector may also be... more
The Co-design for All course is a free online programme on how to put together a case study proposal using a co-design approach. It is aimed at anyone who is interested in learning about co-design... more
This course presents the different customer interactions that happen in a retail setting and allows you to experience real interactions through simulations and scenarios. Interactions examined... more
Cloud FinOps: Master Your Cloud Finances\\n\\nLevel Up Your Cloud Game:\\n\\nThis Cloud FinOps specialization empowers professionals (finance, engineering, operations) to collaborate and optimize... more


