BiteSize Python: Data Visualization
About this Course
This course focuses on data visualization, an essential skill for effectively communicating insights derived from data. It introduces three widely used Python packages: Matplotlib, Seaborn, and Plotly, each known for its unique capabilities in data visualization. The course covers the basics of these libraries and demonstrates how to create a variety of visualizations, from simple plots to complex interactive graphics. Through hands-on practice and case studies, students will learn how to choose the right visualization for their data, customize their plots, and create compelling visuals that convey meaningful insights. Optional case studies will allow students to deepen their understanding by applying these tools in real-world scenarios.Created by: University of Colorado Boulder

Related Online Courses
This course prepares you to recognize the complexities and nuances of different renewable energy solutions, as well as relevant career opportunities (both technical occupations and roles not... more
Course Description The Security Exam Preparation Course is a series of online courses covering topics including Linux and Windows OS basics and operations, network fundamentals, host security,... more
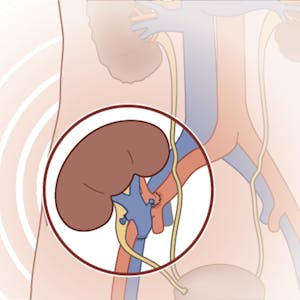
Kidney transplantation is a major advance of modern medicine which provides high-quality of life for patients with end-stage renal disease. What used to be an experimental, risky, and very limited... more
This course is the continuation of \"Introduction to Enterprise Growth and Innovation\". If you have not visited the first part yet, please check it out before starting this course. If you have... more
We have all seen forensic scientists in TV shows, but how do they really work? What is the science behind their work? The course aims to explain the scientific principles and techniques behind the... more


