
Data Visualization & Dashboarding with R
About this Specialization
This Specialization is intended for learners seeking to develop the ability to visualize data using R. Through five courses, you will use R to create static and interactive data visualizations and publish them on the web, which will you prepare you to provide insight to many types of audiences.Created by: Johns Hopkins University

Related Online Courses
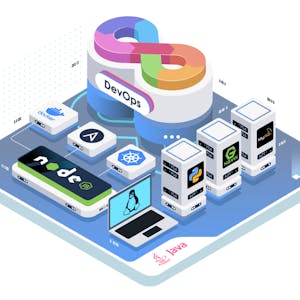
This specialization is intended for aspiring DevOps professionals and IT enthusiasts. Through 8 comprehensive courses, you will cover essential topics including DevOps prerequisites, Git, Jenkins,... more

Dive into the world of AI-powered productivity with Bing Copilot in this dynamic and interactive project. Designed for beginners and professionals alike, this course will guide you through the... more

Using SAS Visual Forecasting and other SAS tools, you will learn to explore time series, create and select features, build and manage a large-scale forecasting system, and use a variety of models... more
Want to solve a murder mystery? What caused your computer to fail? Who can you trust in your everyday life? In this course, you will learn how to analyze and assess five common forms of inductive... more
This is a self-paced lab that takes place in the Google Cloud console. This lab will teach you how to use the Pipeline Studio in Cloud Data Fusion to build an ETL pipeline. Pipeline Studio exposes... more
Powered by
![]()

