
Use Tableau for Your Data Science Workflow
About this Specialization
This specialization covers the foundations of visualization in the context of the data science workflow. Through the application of interactive visual analytics, students will learn how to extract structure from historical data and present key points through graphical storytelling. Additional topics include data manipulation, visualization foundations, audience identification, ethical considerations, dashboard creation, and report generation. Demonstrations of the basic visualization techniques used in Tableau will be included with a hands-on project.Created by: University of California, Irvine

Related Online Courses

Designed to provide a holistic approach to business interactions, this curriculum combines essential skills in feedback delivery, teamwork, and writing to transform you into a proficient and... more
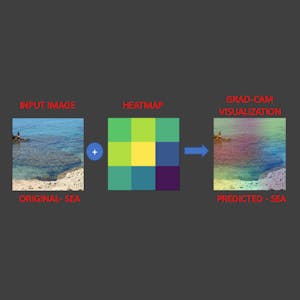
In this 2 hour long hands-on project, we will train a deep learning model to predict the type of scenery in images. In addition, we are going to use a technique known as Grad-Cam to help explain... more
Gain a fundamental understanding of blockchain technology and its components. Learn how such applications as cryptofinance makes use of the blockchain for decentralized, peer-to-peer transaction... more
This is a self-paced lab that takes place in the Google Cloud console. Data Studio lets you create dynamic, visually compelling reports and dashboards. Watch the short video more

This course teaches learners the underlying principles behind conventional radiography, computerized axial tomography (CT), magnetic resonance imaging (MRI), and ultrasound. The radiology of chest,... more
Powered by
![]()

